
Ground Contact Time: What's a Good Number, and Does It Matter?
What ground contact time means on your Garmin, what's a good GCT, why pace changes it so much, and whether you should try to lower it, with real data from my own runs.
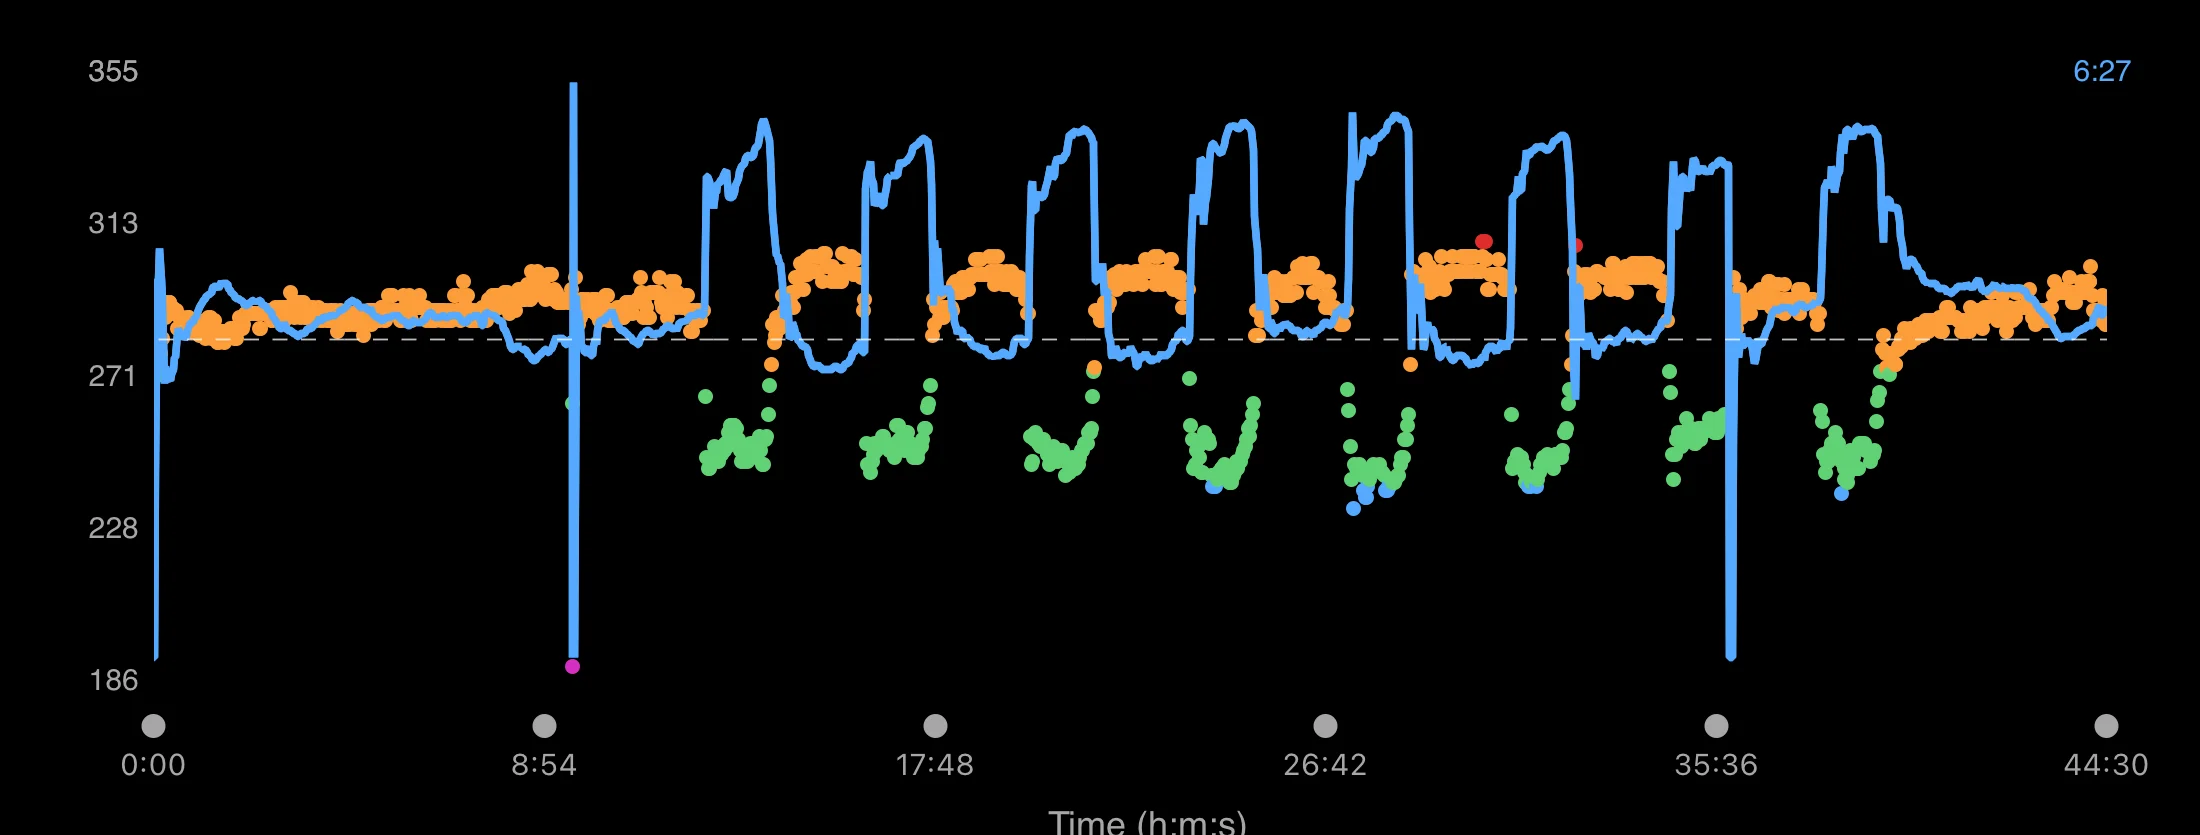
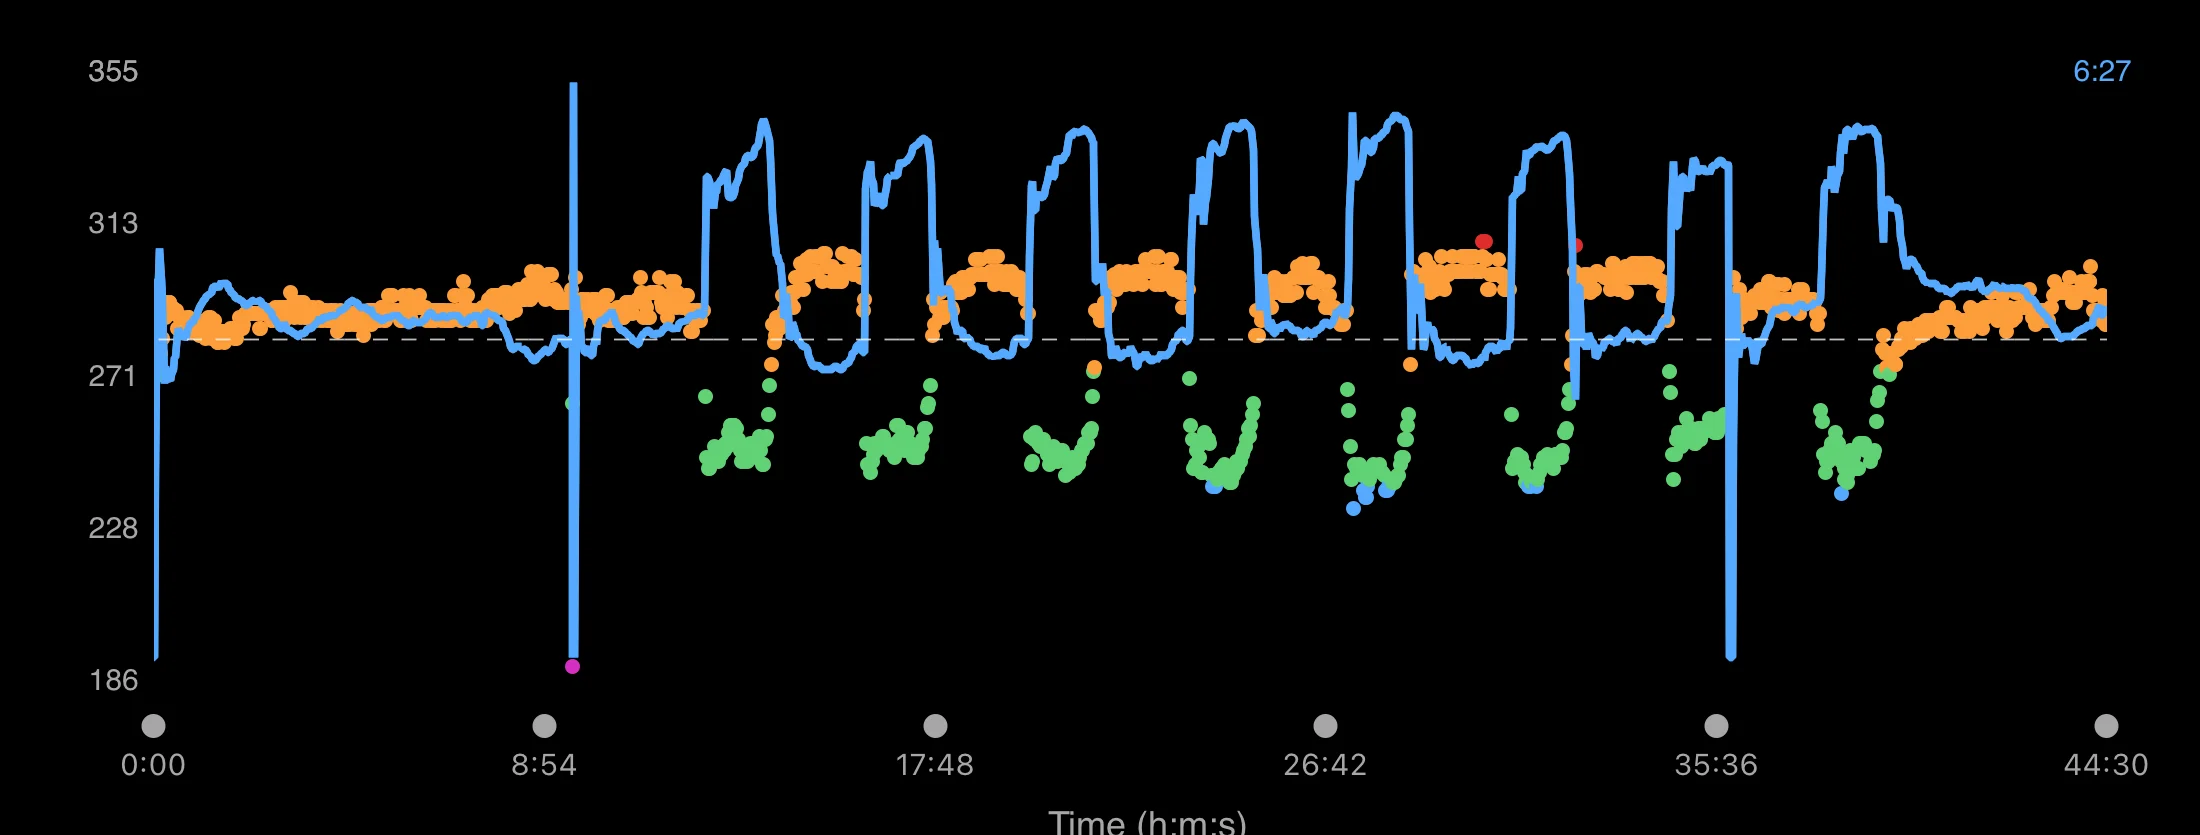
Today I ran hill repeats. When I looked at my watch afterward, my ground contact time was all over the place: about 228 milliseconds on the fast reps, and up around 300 on the recovery jogs. Same runner, same shoes, same morning.
That one workout explains almost everything you need to know about ground contact time. It's a real measurement of your stride, and it can tell you something useful. But the number on your watch depends mostly on how fast you're running, and that's where a lot of runners get confused.
Here's what ground contact time is, what counts as a good number, and whether you should try to change yours.
What's In This Guide
What Is Ground Contact Time?
Ground contact time (GCT) is how long your foot stays on the ground with each step, measured in milliseconds. It starts when your foot lands and ends when it pushes off.
A quarter of a second doesn't sound like much, but you take thousands of steps on every run, so small differences add up.
How your watch measures it: Compatible Garmin watches can estimate ground contact time using wrist-based running dynamics. Some models and setups also support external sensors, like a chest strap (HRM 600 or HRM-Pro) or a Running Dynamics Pod clipped to your waistband, which add more running dynamics measurements, including left-right balance (more on that below). Which metrics you get depends on your watch and accessories.
All the numbers in this article come from my Forerunner 255 on my wrist, with no chest strap.
What's a Good Ground Contact Time?
Garmin shows GCT with a color gauge that compares you with other runners:
| Color | Ground contact time | Where you rank |
|---|---|---|
| Purple | Under 218 ms | Top 5% |
| Blue | 218–248 ms | 70th–95th percentile |
| Green | 249–277 ms | 30th–69th percentile |
| Orange | 278–308 ms | 5th–29th percentile |
| Red | Over 308 ms | Bottom 5% |
As a rough generalization, most recreational runners land somewhere between about 250 and 300 ms, depending on pace. It's not a universal reference range. Elite distance runners are often closer to 200 ms when running fast or at race pace.
I always figured the goal was to get under 300. That's not a bad rule of thumb. Under about 308 ms gets you out of Garmin's red zone. But notice what those colors actually are: percentiles, not targets. Garmin says more experienced and faster runners tend to land in green, blue, and purple. That doesn't mean turning orange into green will make you faster. The faster running comes first.
Why Pace Changes Everything
Here's my own data from the last month:
| Run | Pace | Cadence | Ground contact time |
|---|---|---|---|
| Hill repeats (fast reps) | About 7:00/mile uphill | Up to about 195 | About 228 ms at the lowest |
| Des Moines Marathon | About 8:08/mile | 167 average | 272 ms average |
| Easy run | 9:15/mile | 161 average | 287 ms average |
| Recovery jogs between hill reps | About 9:30/mile | — | Up around 300 ms |
Every time I ran faster, my ground contact time dropped. That's not a coincidence. When you run faster, you push off harder and your foot spends less time on the ground. Researchers see the same pattern in elite runners.
You can see it clearly in the chart from my hill workout. The blue line is my pace, and the dots are my ground contact time, colored with Garmin's zones. Every time the pace line jumps up for a rep, GCT drops into green and blue. When I jog back down, it climbs right back into orange.
This is why comparing your GCT with a friend's doesn't mean much. If you run your easy days slow (and you should), your easy-run GCT will look "bad." That's fine. Mine sits around 287 ms on easy runs, firmly in orange, and it stays there the whole run.
The better way to use GCT is to compare yourself with yourself, at the same pace, over months. If your easy-pace GCT gradually changes from 290 to 275 over a training block, that's worth noticing. Just make sure you're comparing similar runs and looking at the bigger picture, including pace and effort. Terrain, shoes, conditions, and normal measurement variation can all move the number.
What about fatigue?
You'd expect GCT to climb late in a marathon as your legs get tired. Here's my Des Moines Marathon:
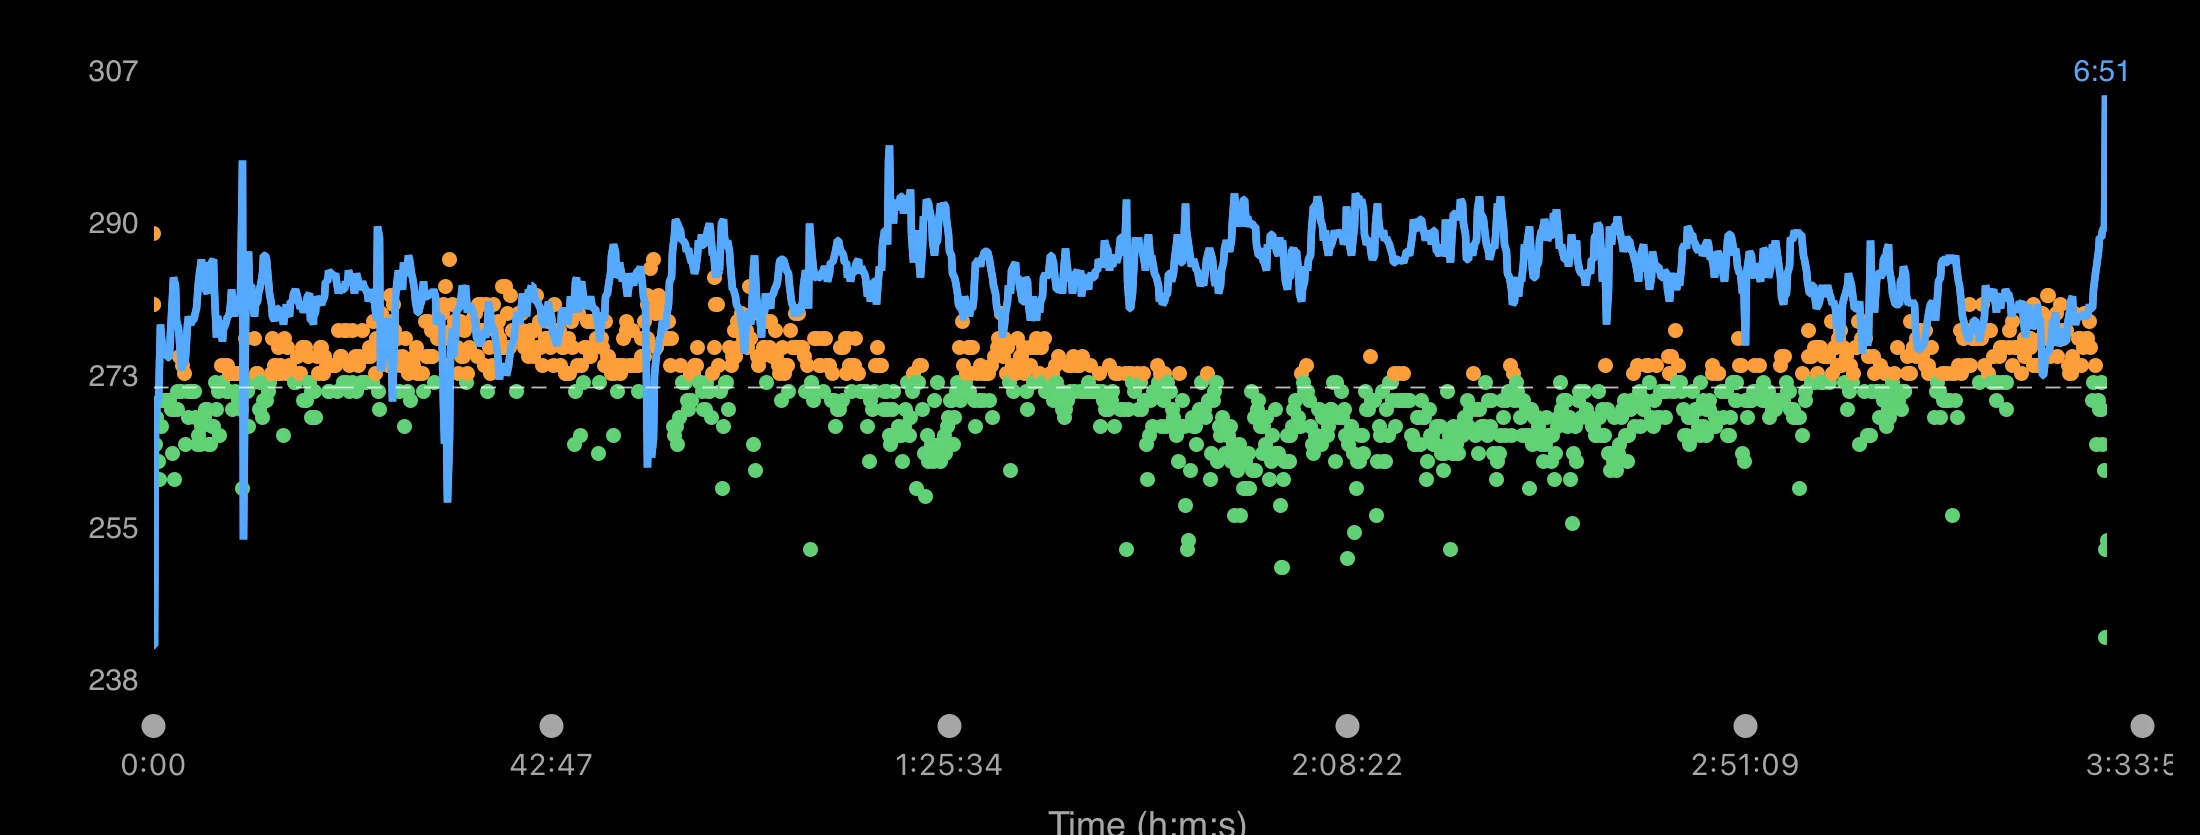
My ground contact time was actually highest in the first hour or so, when I was running the slowest. I started conservatively, then ditched my original plan around mile 6 and picked it up. Once I sped up, GCT dropped into green and mostly stayed there. It crept up a little in the last few miles, but not much.
In my marathon data, the relationship with pace was much more obvious than any increase from fatigue. That's a good reminder not to read every small change in GCT as a sign your form is falling apart.
Ground Contact Time and Cadence
Ground contact time and cadence often move in opposite directions. As you run faster, cadence typically goes up and ground contact time goes down. But they're separate measurements, and neither number tells the whole story about your running form.
Look at my cadence from the same marathon:
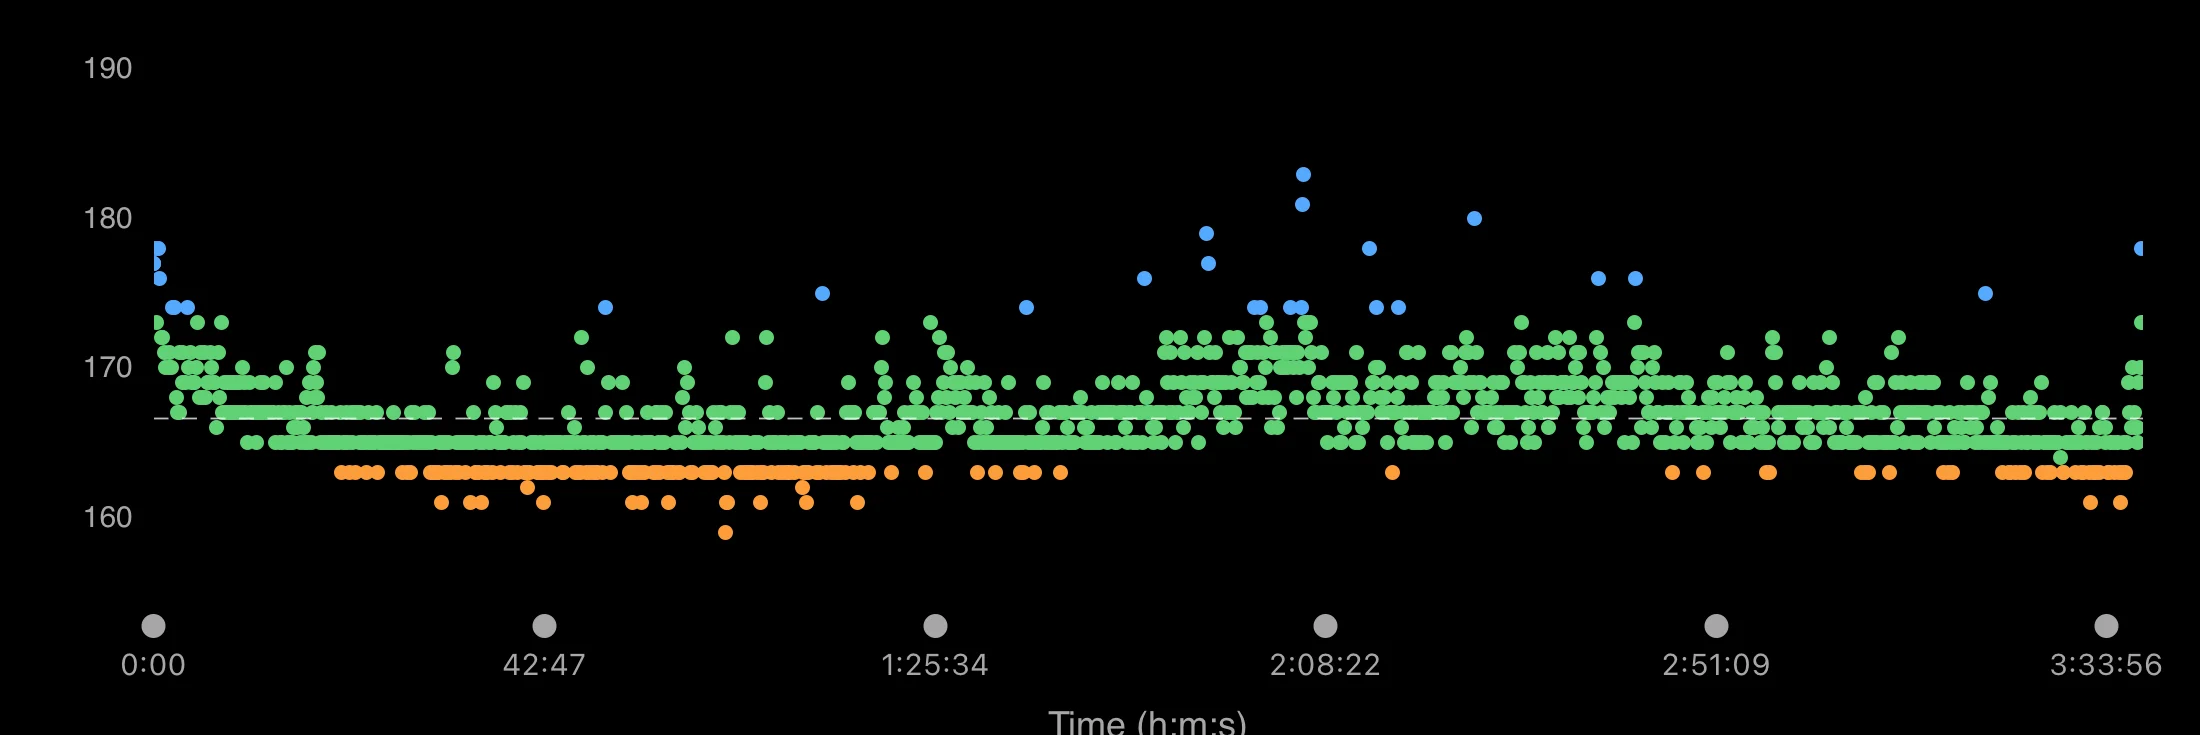
It's almost a mirror image of the GCT chart. My cadence was lowest (the orange dots) in the slow early miles, right where my GCT was highest. In the middle of the race, when I was running faster, my cadence went up and my GCT went down.
I've focused more on cadence than GCT in my own training, and I've noticed that when my cadence goes up, my GCT tends to come down. But I don't think the answer is to force a sky-high cadence on every run. Let it rise naturally as you get faster and stronger. There's more on that in the cadence article.
Does a Lower GCT Make You Faster?
This is where it gets interesting, because the research is mixed.
- The case for shorter contact: Elite Kenyan runners in one study had ground contact times about 10% shorter than other published elite runners at similar speeds, along with a lower oxygen cost of running. The researchers suggested short contact times might help explain their exceptional running economy.
- The case against reading too much into it: That same study found no significant link between gait measures, including GCT, and running economy within the group. A 2024 systematic review of 51 studies and 1,115 runners also found no meaningful overall link between ground contact time and running economy. Cadence did a little better: a higher cadence had a small link with better economy. Other research suggests the relationship is more complicated than simply spending less time on the ground. Some studies have even found that shorter contact at the same speed can mean a higher energy cost.
The honest takeaway: faster, more experienced runners tend to have shorter ground contact times, but there's no strong evidence that trying to shorten yours on purpose will make you more efficient. GCT is mostly a result of good running, not a cause of it.
Should You Try to Lower It?
Not directly. Trying to "be light on your feet" or "get off the ground faster" on an easy run usually just makes you tense.
Instead, do the things that make you faster and more powerful. Lower GCT tends to come along with them:
- Strides and hill sprints. Short, fast efforts teach your legs to push off quickly and forcefully. My hill repeats are a good example.
- Strength training. Stronger legs and hips can help you produce force more effectively. Research has found that strength training can improve running economy in distance runners. If you don't lift, start with strength training for runners. The off-season is a great time to build it.
- Plyometrics. Jumping drills like skips, bounds, and pogo hops train your tendons to store and return energy. Start small and build gradually, especially if you're new to them.
- Don't overstride. Reaching too far out in front of your body can increase braking forces with every step. Focus on landing with your foot closer to your center of mass rather than trying to shorten your ground contact time. See heel striking and overstriding.
- Get faster. Since pace drives GCT more than anything else, the best "GCT workout" is simply good training. Start with how to get faster at running.
Then check your GCT at your usual easy pace every month or two. If it's slowly dropping at the same pace and effort, on similar routes, that's a good sign, but look at it alongside your pace and how your runs feel, not on its own.
Ground Contact Time Balance
Ground contact time balance compares how long your left foot stays on the ground with how long your right foot does, shown as a percentage. A perfectly even stride would be 50/50, like 50.0% L and 50.0% R.
This one usually needs a chest strap or Running Dynamics Pod. It can't be measured from one wrist, so if you're wondering why your watch doesn't show it, that's why.
A small imbalance is normal and isn't automatically a problem. Most of us aren't perfectly symmetrical, and plenty of healthy runners show a slight lean to one side. A noticeable or sudden change, though, can sometimes be a sign that you're favoring one side because of tightness, weakness, or a developing injury.
A watch metric can't diagnose an injury. If something hurts, or you notice you're favoring one leg, take it seriously. Not sure who to see? Here's whether to start with a doctor or a physical therapist.
If you want balance data plus Garmin's newest running metrics, a chest strap is the way to go. I compared what you get with and without one in Forerunner 570 vs 970.
FAQ
What is ground contact time in running? It's how long your foot stays on the ground with each step, measured in milliseconds. Your watch estimates it from motion sensors on your wrist, or from a chest strap or foot pod.
What is a good ground contact time? In Garmin's color gauge, under 248 ms puts you in the top 30% of runners, and 249 to 277 ms is about average. As a rough guide, most recreational runners land between about 250 and 300 ms. But your number depends mostly on your pace, so compare yourself with yourself at the same pace.
Is 300 ms ground contact time bad? Not on its own. It's common on slow easy runs and recovery jogs. Mine gets close to 300 on recovery jogs and drops to about 228 when I run hard. Look at the number in context: your pace, terrain, and how it changes over time matter much more than hitting an arbitrary target.
Why is my ground contact time higher on easy runs? Because you're running slower. Slower running means a longer time on the ground with each step. That's normal and not a sign of bad form.
How do I lower my ground contact time? Don't try to force it. Strides, hill sprints, strength training, plyometrics, and avoiding overstriding all tend to lower it naturally, and getting faster lowers it most of all.
Does cadence affect ground contact time? They're related. As you speed up, cadence usually rises and ground contact time usually falls, so the two tend to move in opposite directions. But they're separate measurements, and a higher cadence doesn't automatically mean shorter contact at every speed.
Why doesn't my watch show ground contact time balance? Left-right balance usually needs a chest strap or a Running Dynamics Pod. Wrist-only running dynamics can't measure it.
This article is for general information and isn't medical advice. If you have pain or a possible injury, talk to a doctor or physical therapist.
Sources
- Garmin. Running dynamics and color gauge ranges (owner's manuals).
- Santos-Concejero J, et al. Are gait characteristics and ground reaction forces related to energy cost of running in elite Kenyan runners? Journal of Sports Sciences, 2017.
- Chapman RF, et al. Ground contact time as an indicator of metabolic cost in elite distance runners. Medicine & Science in Sports & Exercise, 2012.
- Van Hooren B, et al. The relationship between running biomechanics and running economy: a systematic review and meta-analysis of observational studies. Sports Medicine, 2024.
- Kram R, Taylor CR. Energetics of running: a new perspective. Nature, 1990.
- Balsalobre-Fernández C, et al. Effects of strength training on running economy in highly trained runners: a systematic review with meta-analysis. Journal of Strength and Conditioning Research, 2016.
Related Articles
Amazfit: The Best Value Running Watch Americans Have Never Heard Of
Is Amazfit any good for running? Who makes it, how accurate the GPS and heart rate really are, and the 7 Amazfit watches worth buying, with Garmin and Coros alternatives.
12 min readWhat to Do in the Running Off-Season: How to Keep Your Fitness Between Races
Your race is over. Now what? How much fitness you lose if you stop, how to pick an off-season goal, and how to come out of winter fitter than you went in.
10 min readHow Long Does It Take to Improve Your Half Marathon or Marathon Time?
How much can you realistically take off your half marathon or marathon in one training block? Here's what the research says about how experienced runners improve, plus the real numbers from my 19-minute marathon PR at 44.
11 min read
Phil Parker
Phil is a seasoned distance runner and web developer based in Iowa. He has run 15+ half marathons and 3 full marathons, and built PR Nerd because he was tired of paying for running apps that did not use real training science.
More about Phil →Follow on Strava →Comments
No comments yet. Be the first.
Leave a comment
Not published
0/1000
Ready to put this into practice?
Build your free personalized training plan based on your actual fitness — not your goal.
Build my plan →Get monthly running research, pace strategies, and fresh training articles. Zero fluff.